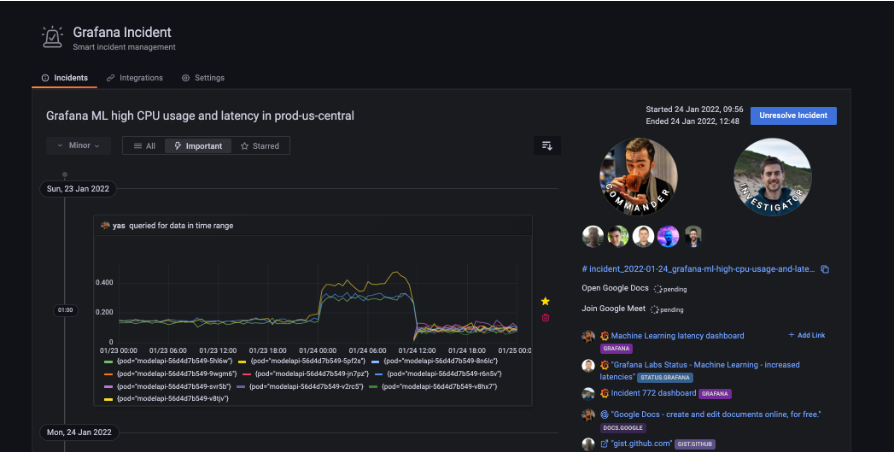
NewYork, NFAPost: Grafana Labs, the company behind the world’s most ubiquitous open and composable operational dashboards for observability strategies, has come up with a new tool Grafana Incident for preview as part of Grafana cloud service.
Grafana (https://grafana.com/) is a multi-platform open-source analytics and interactive visualization web application. It provides charts, graphs, and alerts for the web when connected to supported data sources.
A licensed Grafana Enterprise version with additional capabilities is also available as a self-hosted installation or an account on the Grafana Labs cloud service. End users can create complex monitoring dashboards using interactive query builders. It is expandable through a plug-in system.

With this move, Grafana Labs enhances their recently announced service ‘Grafana Oncall’ to next level. Grafana oncall is already available at their Cloud and Community offerings.
Grafana Incident’s key features are:
- Automates creates your Slack channel and Zoom meeting space creation
- It lets you assign important roles that follow industry standard practices so that everybody knows who’s doing what.
- It lets you manage TODO items so no tasks fall through the cracks.
- It builds up a timeline of events to make your postmortems richer and better informed.
- Integrations into your other Grafana data optionally provide additional insights to help your teams diagnose incidents.
A chatbot feature is built in to Grafana Incident which help engineers to interact without even opening a web browser. A familiar command-line interface let them create incidents, assign roles, manage tasks, add notes, and more.
As per Grafana labs announcement, Grafana incident referred as’Grafana Incident’ makes incident management easier by automating common tasks and giving teams a dedicated place to work.”
Grafana incident is currently available at Grafana Cloud with no additional cost. You can try grafana cloud for free here
In August 2021, Grafana Labs secured a Series C funding of $221 million co-led by new investors Sequoia Capital and Coatue, with participation from existing investors Lightspeed Venture Partners, Lead Edge Capital, and GIC.
Led by its Cofounder and CEO Raj Dutt, Grafana Labs is witnessing rapid adoption of its cloud service led by Loki logs and Prometheus metrics offering. Also, the introduction of Tempo 1.0 for tracing and the continued development of the Grafana frontend gave global recognition to the company.
According to Arvian Research, the growth of Grafana Labs from a single open source project into a comprehensive platform fully managed with Grafana Cloud, or self-managed with Grafana Enterprise Stack is phenomenal.
“Now the company’s solutions are widely used across the Fortune 500 and Forbes Global 2000, helping companies make better decisions based on actionable data. Besides expansion of headcount since its inception, the company is scaling its solutions across the enterprise is really phenomenal,” said Arvian Research.
There are over 2000 Grafana Labs customers including Bloomberg, JP Morgan Chase, eBay, PayPal, and Sony, and more than 9 lakh active installations of Grafana around the globe.


