Household financial liabilities nosedived in FY20: Reflecting significant slowdown in disposable income, likely to gain faster pace in FY21?
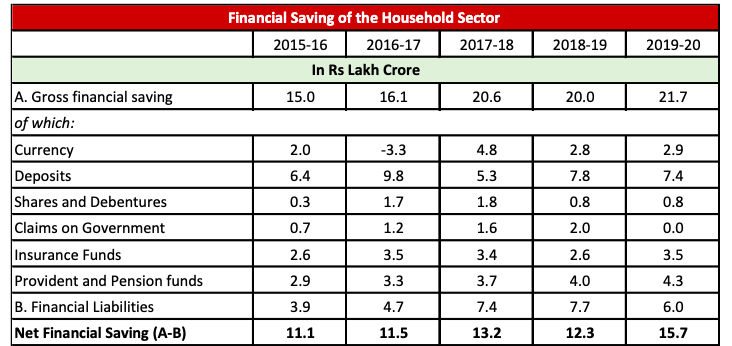
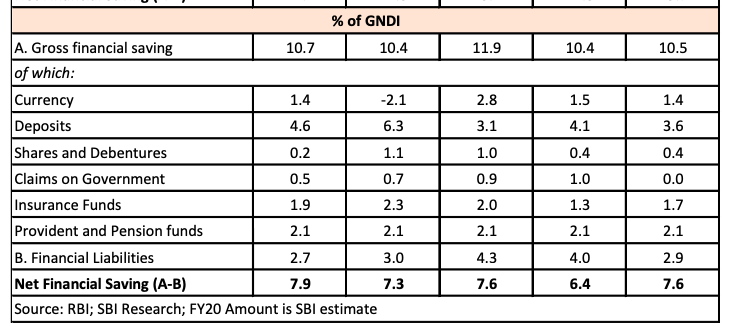
The RBI Annual Report reaffirms our conviction that the current slowdown in growth will be long and protracted. For the record, Net Household Financial Savings of the Household jumped by Rs 3.4 lakh crores in FY20, largely reflecting a significant meltdown in household financial liabilities in FY20 by 22% that had increased by 39% for the 6 year period ended 2019.
While the decline in net financial liability is a welcome departure, on hindsight it portrays unwelcome trends in household saving behavior. For one thing in common, households were able to increase their liabilities / leverage significantly over the 6 year period ended FY19 by as much as 1.9 times, with disposable income jumping by 2.3 times.
However, in FY20, disposable income has expanded by only 0.8 times, and liabilities have thus grown by only 1.1 times. Furthermore, Households in FY20 have drawn down their exposure to Government by a sharp Rs 2 lakh crore and instead increased their exposure to Insurance and Retirement Corpus, perhaps as a precautionary motive and also as a proof that Households are now increasingly trying to “Keep up with Joneses” with income slowdown.

We believe Household Leverage may have further slowed down in FY21 with perhaps even a negative growth in disposable income. This may still not result in a decline in Net Household Financial Savings in FY21 as people have accumulated currency, deposits and even shares in large numbers.
But the bottom line is grim: consumer demand will be a non-starter even in FY21 and continue to be pandemic proof through increased precautionary savings as pandemic continues to ravage through the economy.

Elsewhere, some developments suggest that the shrinkage of world trade may be bottoming out in the third quarter of 2020, that India should take advantage of. The problem is, India is still in the midst of a significant pandemic disruption that indicates Q2GDP for India could also be a washout.
Meanwhile, regarding the RBI balance sheet, it clearly changed after 20-March with rupee securities holding witnessing an increase while the growth in foreign currency assets moderating. The pre and post-Covid period does not show any major difference in growth of notes issued.
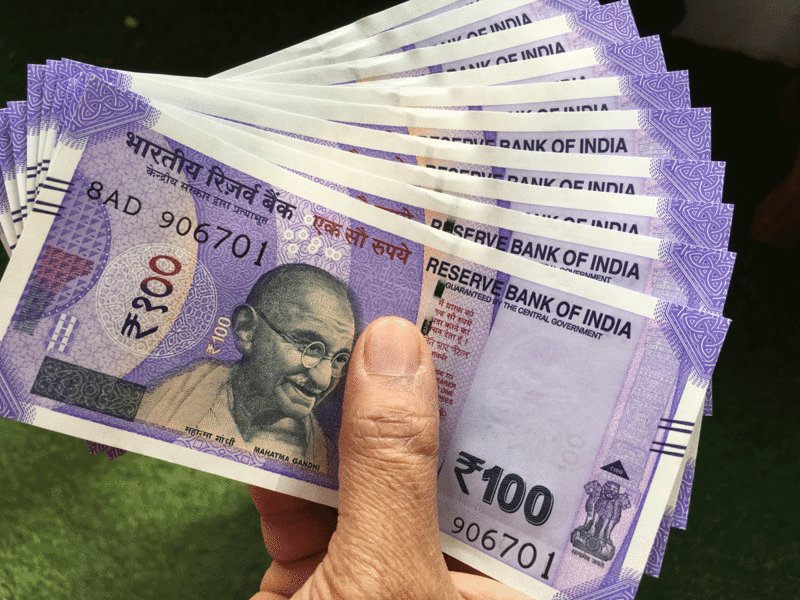
One more interesting part of information from the RBI AR is the currency composition of RBI. Interestingly, the number of banknotes in circulation has grown by 7% to 116 billion pieces as on Mar’20. 2000 denomination note which was launched after demonetisation, has not been printed with its number going down to 2.7 billion pieces as on Mar’20, from 3.3 billion pieces in Mar’19.
The share of 2000 denomination notes has come to 22.6%. This was 50% in 2017, as the major focus was on remonetising the economy. The % composition of bank notes in value terms shows that 500 denomination notes have 60.8% share in the total value of bank notes in circulation, which is 24,210 billion (y-o-y increase: 15%).
With the printing of 500 denomination notes taking precedence, due to ease of use, the value of 2000 denomination notes has declined by Rs 11 lakh crore in the economy, from Mar’17 to Mar’20. The combined share of 500 and 2,000 banknotes was, thus 83.4% in the total banknotes in circulation.
As an anecdote, according to RBI, the impact due to factor income loss (capital and labour) of 68 days of lockdown on the manufacturing and mining sectors could be as high as Rs 2.7 lakh crore (on constant prices). Interestingly, as per our published estimates (Ecowrap dated 17 Aug’20), the nominal GVA loss for manufacturing and mining sectors (in Q1) is around Rs 3.1 lakh crore (at current prices).
In FY20 India’s current account deficit was 0.9% of GDP vis-a-vis 2.1% in FY19 as the merchandise trade deficit contracted, reflecting the terms of trade gains accrued from lower commodity prices for crude oil, coal and fertilisers, and a contraction in import volumes.
India received significant amount of capital flows in FY20 (amounting to $83.18 billion), more than enough to cover for cur- rent account deficit (CAD of $24.65 billion). India continued to re- main attractive destination for foreign capital receiving net FDI of $44.41 billion (48% yoy increase).
After witnessing portfolio outflows in FY19, net portfolio investment also turned positive ($1.4 billion). Another major component was net External Commercial Borrowings which increased to $22.9 bil- lion from $10.4 billion in FY19. This in turn led to significant accre- tion of forex reserves ($59.49 billion).
Though a large amount of foreign capital is beneficial for an Economy, however, if there is not absorbed in the economy due to insufficient demand, then there is a possibility of upward pressure on the exchange rate, overheating of the economy and asset price bubbles.
Also, another important point to be highlighted is the quality of imports that are financed by higher CAD. Gold imports which constitute a major proportion of our imports represent non-productive imports. absorption of foreign capital is crucial for economic growth. It is the quality of CAD which matters in enhancing the absorptive capacity of the economy through growth-inducing imports.
As far as external debt position is concerned, it increased by US$ 15.4 billion (20.6% of GDP) from its level at end-March 2019 (19.8% of GDP), primarily on account of commercial borrowings. However, major external vulnerability indicators including share of short-term debt, foreign exchange reserve cover of imports improved during FY20. This should provide support against the current uncertain environment.


